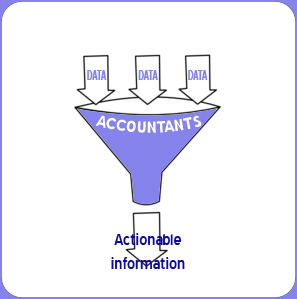
Accountants are really, really good with numbers. We can reconcile your bank statements and do your cost accounting. We can calculate your debits and credits. We can prepare your month-end reports and your cash flow statements and your balance sheets.
But how do we take all those numbers and translate them into meaningful information, in a format that’s user-friendly, in a language that readers – from accounting-sophisticated CFOs to non-technical board and staff members to lay people on a board of directors – can understand? That’s where it gets tricky.
Enter “The Wizards of I.D.D.”™
I.D.D. stands for Information Design and Delivery. It’s an increasingly important approach to the gathering, arrangement, synthesis, and dissemination of financial data that communicates the story behind the numbers. I.D.D. makes technical information relevant. I.D.D. enables audiences to understand what’s unique and what they need to know – when they don’t even know what questions to ask.
Instead of counting the beans, I.D.D. is a way to make the beans count.
“Data by itself is helpful, and it’s interesting, but it’s not necessarily useful,” says Eric Fraint, President and Founder of Your Part-Time Controller. “Data becomes useful only when it becomes dynamic information.”
To translate our clients’ data into relevant information, YPTC has launched a new initiative called The Wizards of I.D.D.™ A team of a dozen staff members from our three offices are meeting regularly to design new and better ways of delivering our reports, taking advantage of exciting new technologies and adapting to the ever-changing world of information technology.
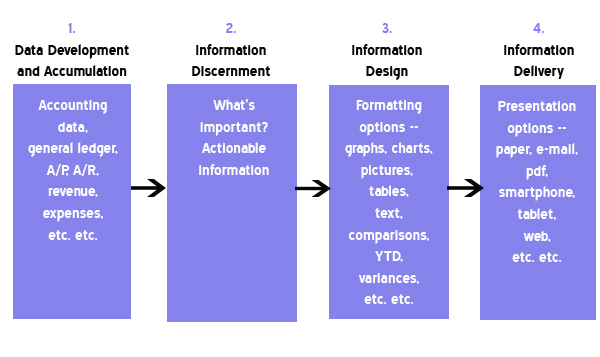
It’s a complicated process, with continually moving pieces. Each client has different needs, their members are using different technological interfaces, and software is constantly changing. A diagram may help explain how I.D.D. works:
Good Information Design and Delivery includes many components. Part of it is the timing: some reports need to be prepared daily or weekly, while others provide monthly, quarterly or annual summaries; some are created on an ad hoc basis. The frequency of how information is needed will impact how it should be formatted and delivered.
Then there’s the question of who the audience is. What works for a CFO, a funder or a financial whiz on the nonprofit’s Finance Committee may be incomprehensible to a program manager, department head, donor, or board member. Each recipient may need a different level of detail. Each may use that information differently. And some readers may be visual learners who respond better to pie charts and graphs, while others prefer tables, while still others would rather see an explanatory written narrative.
Meanwhile, how and when people access the information can vary. Some people want to sit down and study it in a full report that they can file in a looseleaf binder. Others want a quick synopsis that they can read on their smartphone on the train on their way to work.
The life of the data can be significant: some financial metrics are short-term indicators, while others are critical for benchmarking or long-range forecasting. Some numbers need to go on a dashboard, while others eventually turn out to be irrelevant.

As Your Part-Time Controller continues its mission of building a better world, one accounting department at a time, the Wizards of I.D.D.™ will be there to help nonprofits better understand their business.
“Traditionally, accountants just prepared reports on paper,” says Fraint. “With the advent of computers, electronic spreadsheets became possible, and that led to delivering reports in paperless, pdf formats. But today, many of our clients are reading this information on tablets, or smartphones, on which the old formats don’t work. Good Information Design and Delivery is about getting not only timely, accurate information to people, but also making it useful and user-friendly in a format that works for them. YPTC is leading the way in achieving that.”


