Data Visualization
YPTC helps you visualize information clearly in ways that are easy to understand. We work with many kinds of quantitative data, including financials, program data, fundraising, and others, building custom infographics and dashboards that can be tailored for delivery in print, PDF, web pages, and mobile apps.
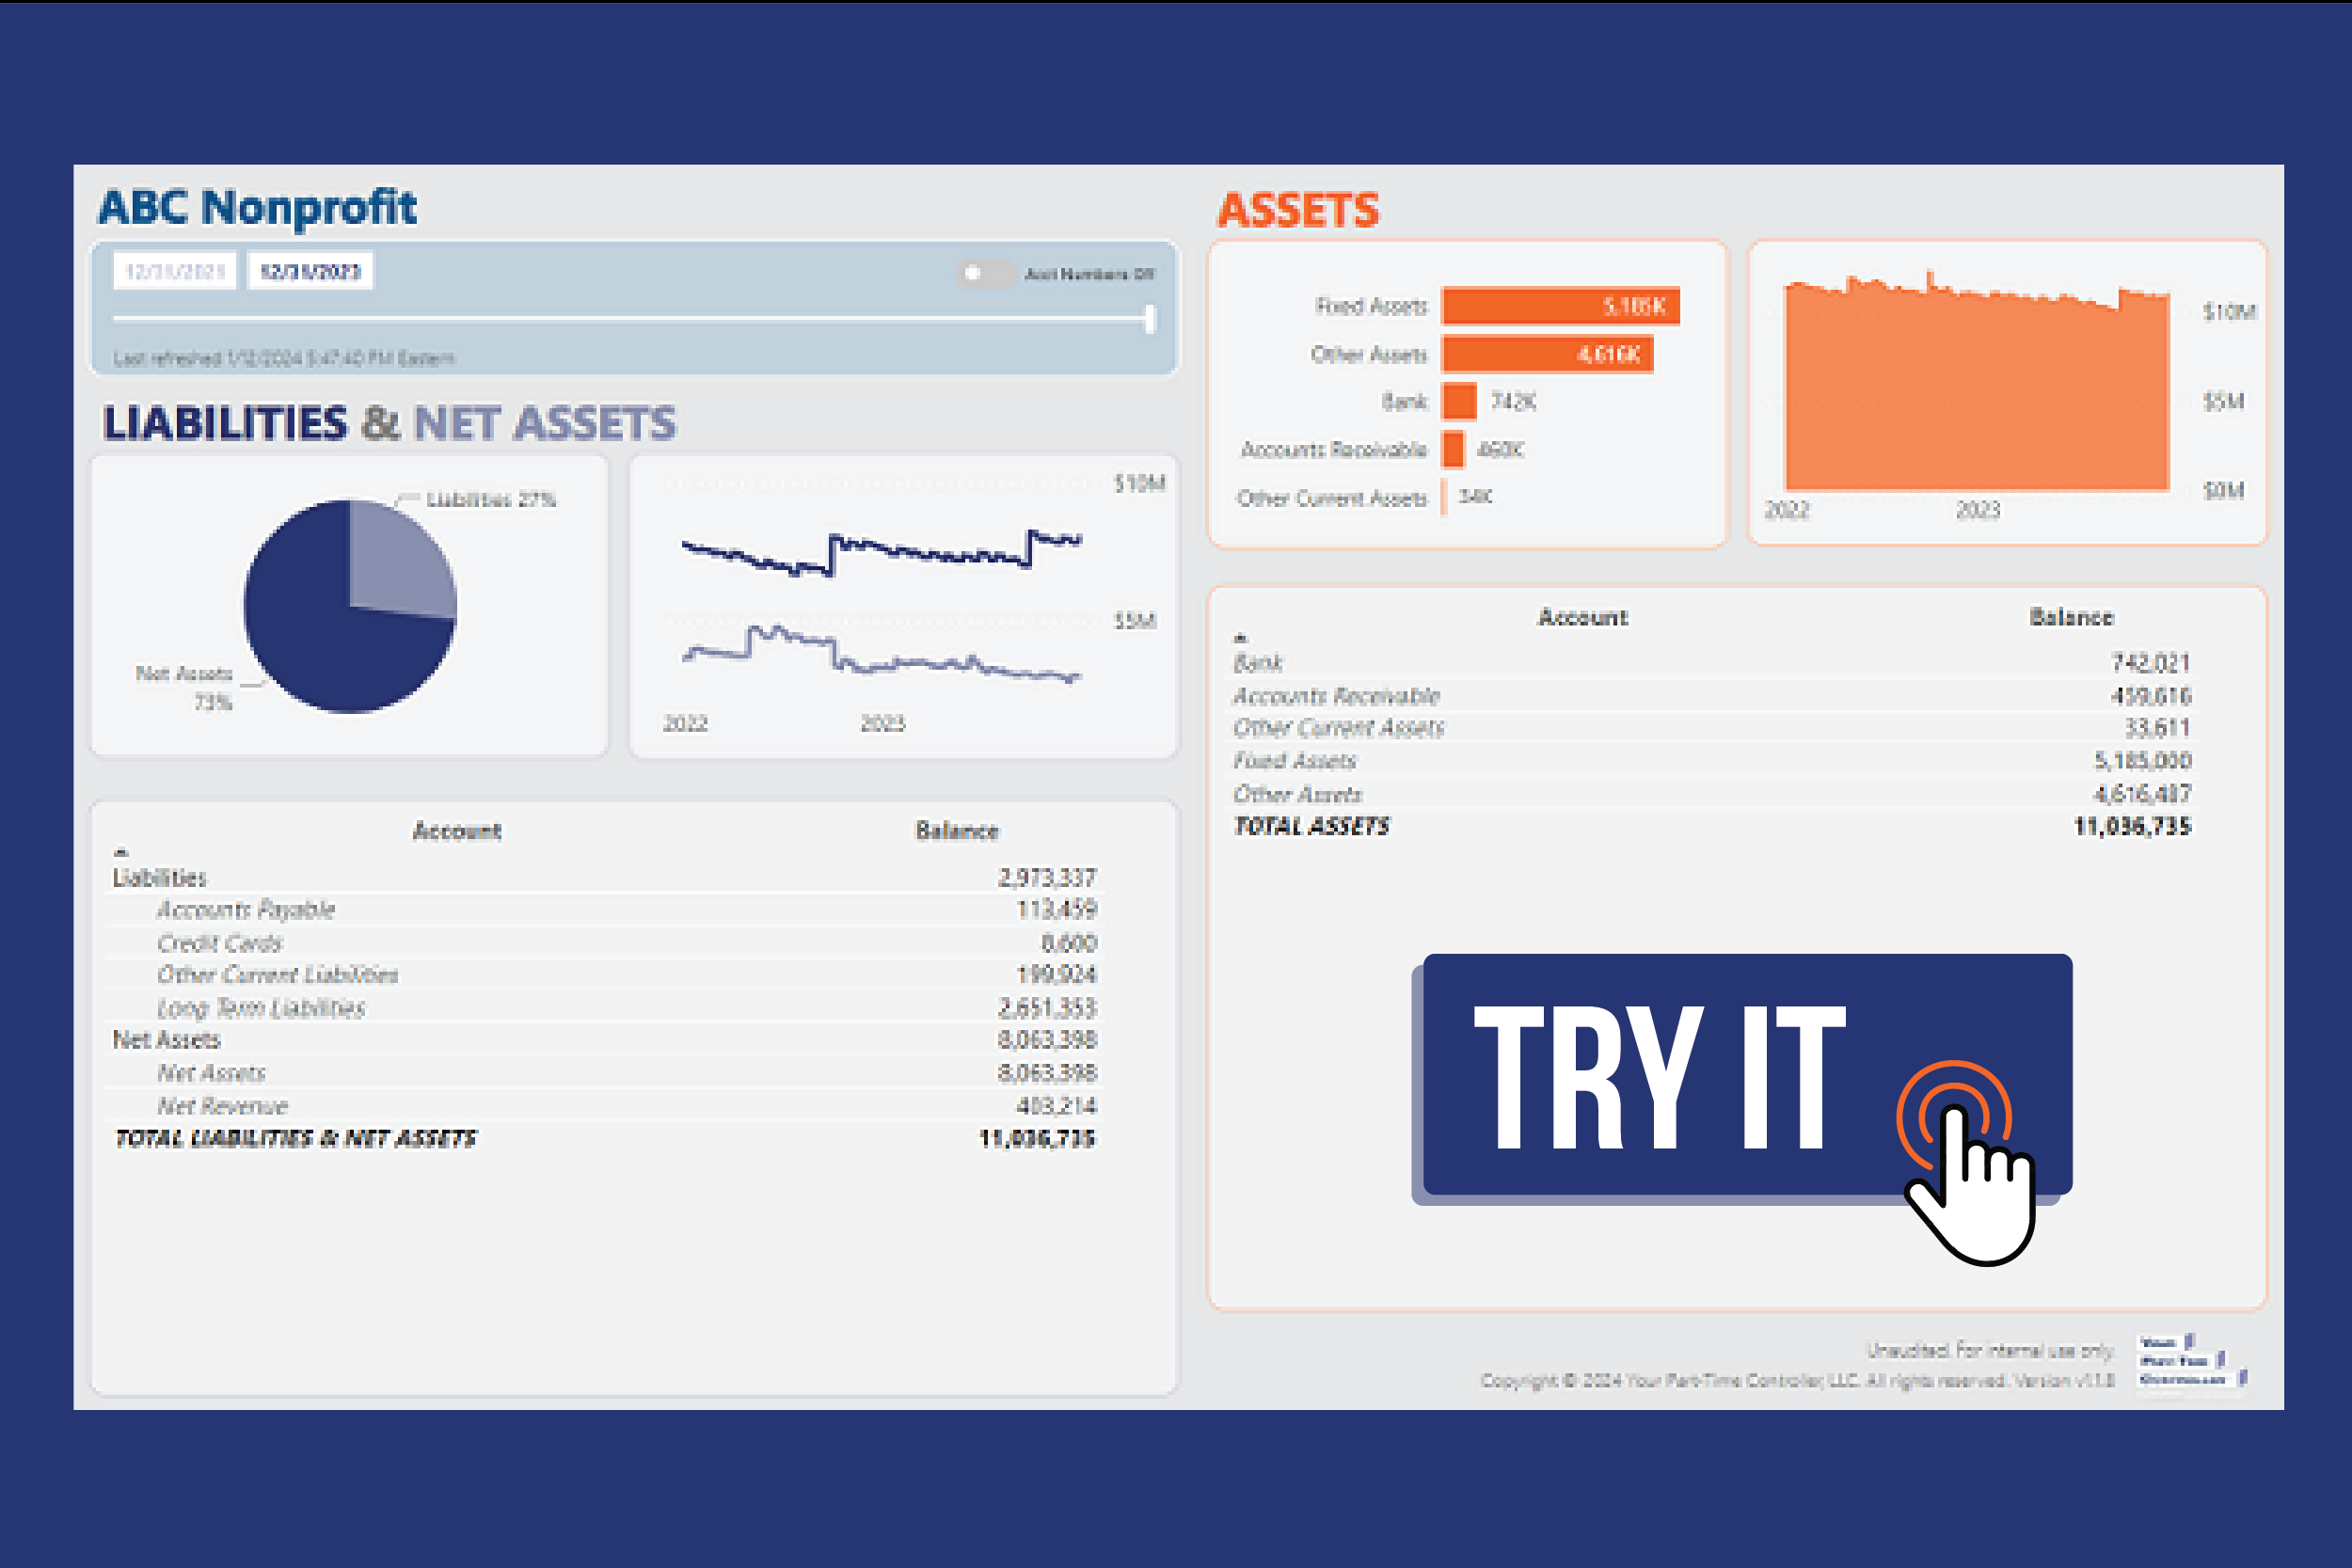
Interactive financials from your accounting system:
- Fully customizable reports to keep you informed about your organization’s financial performance
- Drill down from high-level KPIs to detailed metrics for specific departments, programs, funders, or clients.
- Deliverable to mobile devices and web browsers for anytime, anywhere information.
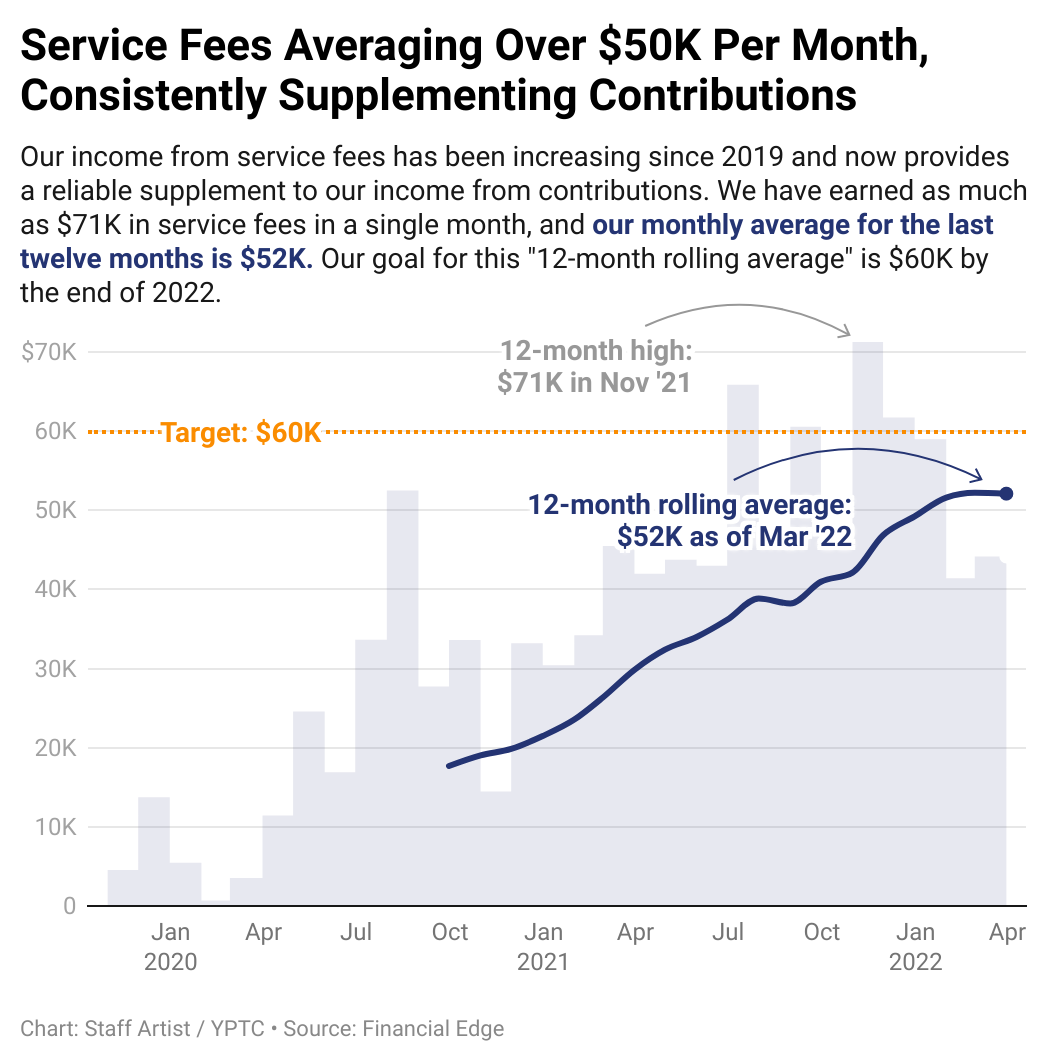
Infographics:
- Make your point quickly and clearly
- Bring your observations to light
- Help your audience to understand
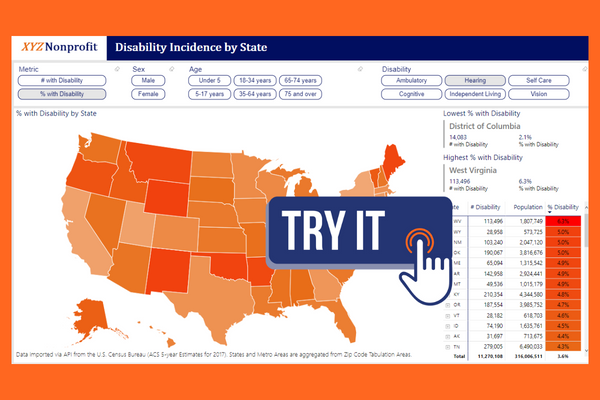
Program and population data:
- Assess your target population using public data sets.
- Interact with the data in ways that make sense for you and your program team.
- Filter and drill down across multiple dimensions and categories to find what you need.
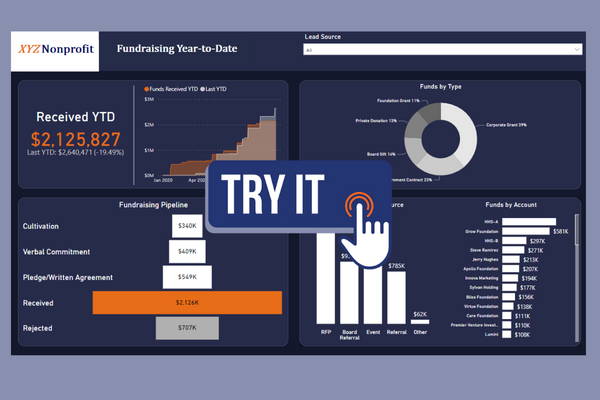
Fundraising data at your fingertips:
- Visualize your fundraising pipeline and drill down into details from your CRM system.
- Compare performance from this year to last year.
- Assess your revenue diversity and stay informed about who has given what.