
6 Data Visualizations to Help with Your Nonprofit Financials
Updated On: 06/30/2025
Does your organization need to track progress toward its goals, and to report on its outcomes? Data visualization can help! Tools such as charts, graphs, dashboards, and other visualizations can turn numbers into stories that:
- Communicate your impact
- Explain your needs and opportunities
YPTC’s Data Visualization Group has curated a list of 6 visualizations nonprofit leaders can start using today to help better run their organization:
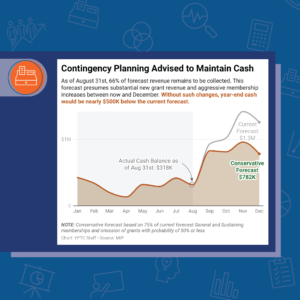
1. Scenario Planning and Alternative Forecast Results
As a nonprofit leader, you might want to know “what would cash be if we didn’t hit our budget goals?”
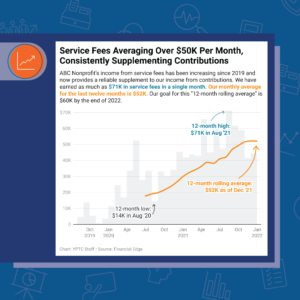
2. Monthly Results and Rolling Average
As a member of a nonprofit organization, you might want to track against your goals.
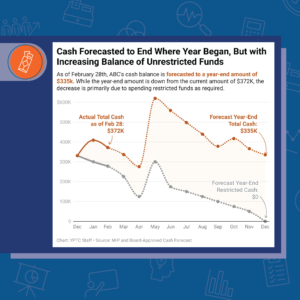
3. Total Cash Vs. Restricted Cash
In this case, the visualization helps a nonprofit leader explain that the decrease in cash for the year would be due to spending down restricted funds.
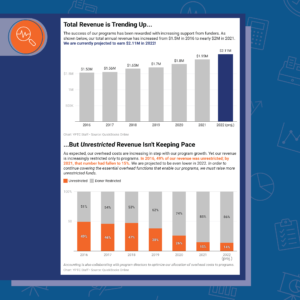
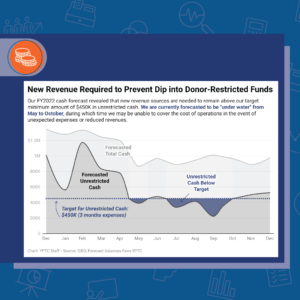
4. Revenue Trends and Unrestricted Vs. Restricted Funding
This “combo chart” explains how an organization increased their revenues year over year but needed to focus on generating more unrestricted revenue.
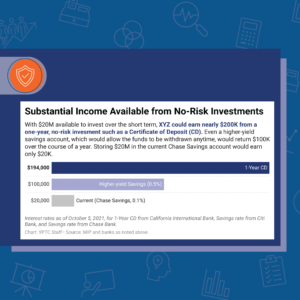
5. Investment Income Opportunities
As a nonprofit leader, you might want to invest idle/surplus cash.
6. Forecasting Cash Compared to a Target or Benchmark
As a nonprofit leader, you need to know if you are on track to meet your goals.
For more like this, visit YPTC’s data visualization static graphic showcase page. Ready to get started? Visit our website and contact us today!
YPTC (Your Part Time Controller, LLC) helps you visualize information clearly in ways that are easy to understand. We work with many kinds of quantitative data, including financials, program data, fundraising, and others, building custom infographics and dashboards that can be tailored for delivery in print, PDF, web pages, and mobile apps.
Our data visualization static graphics are created in accordance with the JD Standard.
The JD Standard refers to our proprietary design format which utilizes narrative prose and artistic graphics combined with visual quantitative data to display business strategy, business operations, financial management, and marketing information.