On Demand! The Art of Charts: Choosing the Right Visualization to Tell Your Story
Updated On: 05/21/2026
Posted On: January 9, 2024
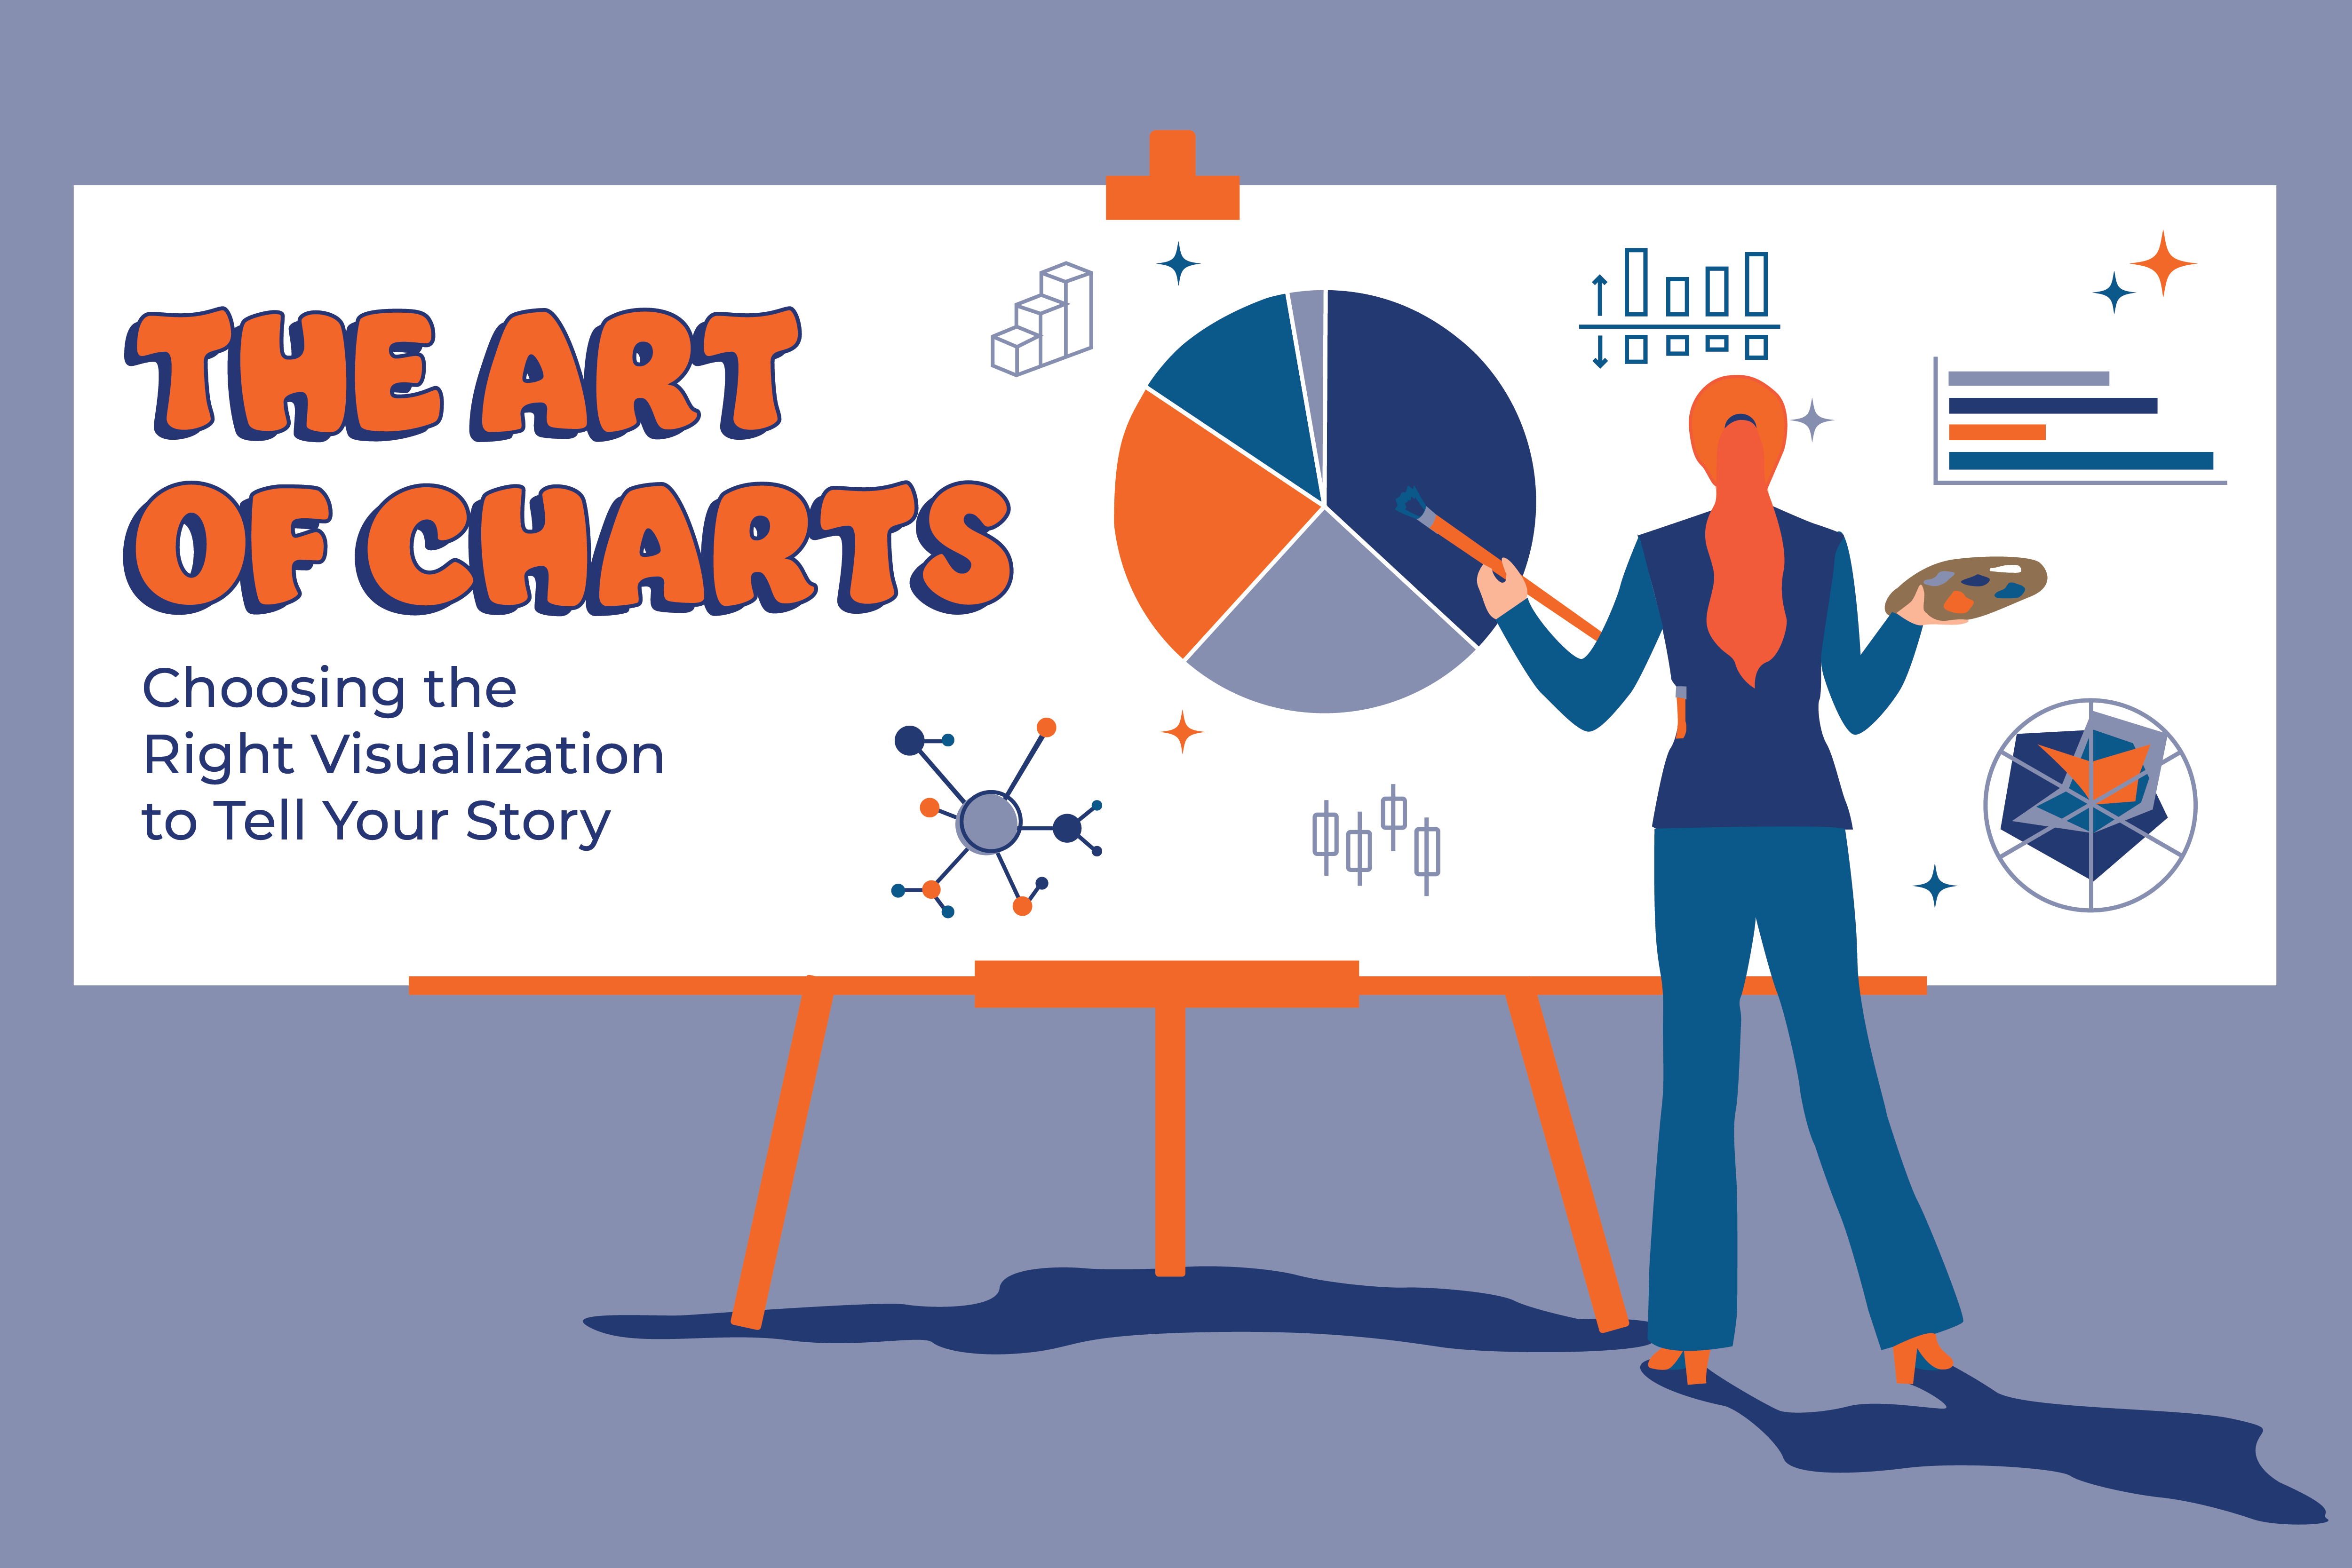
The Art of Charts: Choosing the Right Visualization to Tell Your Story
This event was hosted by IMA, sponsored by Your Part Time Controller, LLC
Date: January 31st, 2024; 1:00 pm-2:00 pm ET
You are probably familiar with the phrase, “A picture is worth a thousand words.” Do you have data but struggle with how best to depict the story the data is telling? Join William Schwab and Edwin Harvey from Your Part-Time Controller, LLC, for this glimpse into the power of data visualization, during which we will share tips, techniques, and examples of effective storytelling graphics. Additionally, we will discuss general best practices for graphic design in the context of data visualization.
Learning Objectives:
- Recognize core concepts and essential elements that contribute to effective data visualization and storytelling graphics.
- Distinguish between different types of commonly used charts.
- Identify which chart types to select based on the data and the story that needs to be told.
- Explain how to Illustrate data visualization storytelling through case study examples.
Find the recording and materials by submitting a request below: